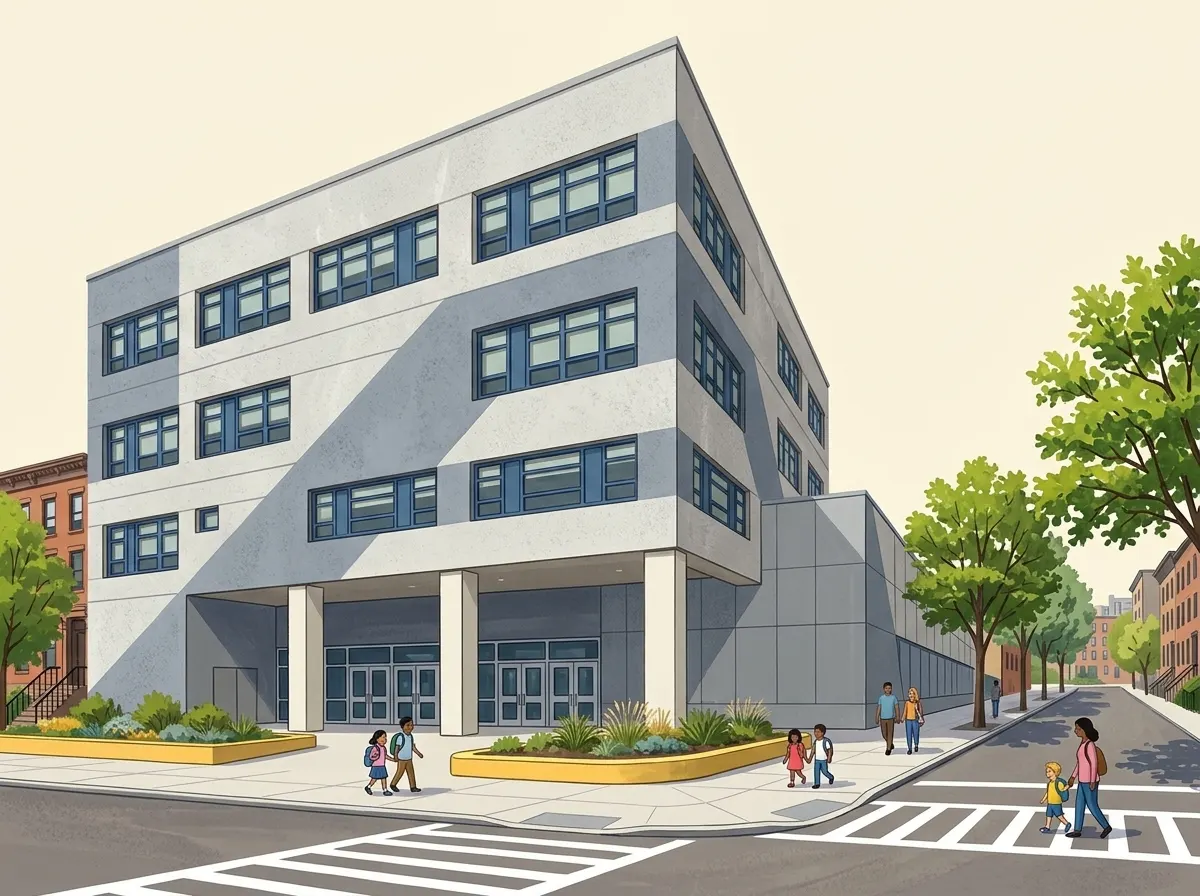
Boys Preparatory Charter School of New York
Grades K-5 · 1695 SEWARD AVENUE · Bronx
Kristan Norgrove, Principal · 718-860-8774
About
Boys Preparatory Charter School of New York is an all-boys K-5 charter school located in the Bronx, committed to preparing its students for college through a strong emphasis on character development and critical thinking. The school's guiding philosophy aims to foster a "warm and joyful culture of rigor" to empower its scholars. Academically, the school demonstrates solid performance, with English Language Arts proficiency at 57% and Math proficiency at 58%, both slightly above the citywide median for elementary schools. Parents express overwhelmingly positive sentiment, with 96-99% favorable responses across various survey questions regarding the school experience. However, student survey results indicate areas for improvement concerning school cleanliness (46% favorable), fair conflict resolution (46% favorable), and the prevalence of bullying or harassment (31% favorable). The school is part of the Public Preparatory Network, which is known for establishing single-sex elementary and middle schools. It holds a distinctive place as the first all-boys public elementary school in the Bronx.
Sources (16)
- Boys Preparatory Charter School of New York Official Data · 2023-2024
- Boys Preparatory Charter School of New York · 2025
- Boys Preparatory Charter School of New York - Equitable Facilities Fund · 2019-2020
- Boys Preparatory Charter School of New York in The Bronx, NY - Niche · 2026
- Boys Preparatory Charter School of New York, The Bronx, NY, K-9 Grade, 24 Reviews · 2022
- Single-Gender Schools - Excellence Community Schools · 2025-2026
- Public Prep - Niche · N/A
- Public Preparatory Charter School Academies (Boys Prep) - Equitable Facilities Fund · 2019-2026
- Boys Preparatory Bronx Elementary - Homes.com · N/A
- Boys Prep Bronx Charter School - District 8 - InsideSchools · 2019-2025
- Boys Preparatory Charter School of the Bronx - AWS · 2022-2023
- Boys Prep Excellence - Schools · 2026-2027
- Boys Preparatory Charter School of New York - NYC Public Schools · N/A
- movoto.com
- amazonaws.com
- niche.com
Academics
State test proficiency rates and acceleration.
ELA proficiency
57%
Math proficiency
58%
Proficiency rates are from the Grade 3–8 NYS state test (school-level).
Attendance rate
—
Avg class size (general ed)
—
Avg class size (ICT)
—
Community & climate
Demographics, attendance, school survey results, and DOE quality ratings.
Quality signals
Parent survey · overall positive
90%80% response rate
Teacher survey · overall positive
73%39% response rate
Student survey · overall positive
61%70% response rate
Survey topics
Safety66%city 80%
- Conflicts are resolved fairly in this school.46%
- I feel safe…outside around this school.53%
- I feel safe…traveling between home and this school.68%
- I feel safe…in the hallways, bathrooms, locker rooms, and cafeteria of this school.62%
- I feel safe…in my classes at this school.68%
- My students are safe…outside around this school.64%
- My students are safe…traveling between home and this school.56%
- My students are safe…in the hallways, bathrooms, locker rooms, and cafeteria of this school.92%
- My students are safe…in my class(es).100%
- Conflicts are resolved fairly in my school.72%
- School Safety Agents promote a safe and respectful environment.70%
- At this school students drink alcohol, use illegal drugs, or abuse prescription drugs.77%
- At this school students get into physical fights.33%
- At this school there is gang activity.61%
Each question’s favorable response rate; the topic score (66%) is their average, vs 80% citywide.
Bullying prevention48%city 57%
- At this school students harass, bully, or intimidate other students.31%
- At this school students harass, bully, or intimidate each other because of their race, religion, ethnicity, national origin, language/accent, or citizenship/immigration status.43%
- At this school students harass, bully, or intimidate each other because of their gender, gender identity, gender expression, or sexual orientation.53%
- At this school students harass, bully, or intimidate each other because of other differences, like different body type or disability.40%
- At this school students harass, bully, or intimidate each other online (through mobile phones, social media, email, or other forms of electronic communication).52%
- At this school students harass, bully, or intimidate other students.70%
Each question’s favorable response rate; the topic score (48%) is their average, vs 57% citywide.
Emotional support57%city 69%
- I know where to go at my school if I need additional support with my mental-health.67%
- During this school year, most days I have felt happy when at school.61%
- During this school year, most days I have felt safe when at school.57%
- During this school year, most days I have felt optimistic when at school.63%
- During this school year, most days I have felt bored when at school.23%
- During this school year, most days I have felt stressed when at school.32%
- During this school year, most days I have felt worried when at school.56%
- There is time at school to talk about feelings and emotions.59%
- How many adults at this school…help students develop the skills they need to complete challenging coursework despite obstacles?.58%
- How many adults at this school…tell their students they believe they can achieve high academic standards?.74%
- How many adults at this school…teach students how to advocate for themselves?.75%
- How many adults at this school…recognize disruptive behavior as social-emotional learning opportunities?.55%
Each question’s favorable response rate; the topic score (57%) is their average, vs 69% citywide.
Personal attention63%city 67%
- In how many of your classes, this school year, do YOU feel the following statement is true? My teachers…ask if I have everything that I need to succeed in their class.60%
- In how many of your classes, this school year, do YOU feel the following statement is true? My teachers…give me specific suggestions about how I can improve my work in class.67%
- In how many of your classes, this school year, do YOU feel the following statement is true? My teachers…explain things a different way if I don't understand something in class.62%
- In how many of your classes, this school year, do YOU feel the following statement is true? My teachers…support me when I am upset.57%
- Adults at this school check in with me frequently about how I’m doing personally.56%
- Adults at this school check in with me frequently about how I’m doing academically.71%
- I feel like I belong at this school.67%
Each question’s favorable response rate; the topic score (63%) is their average, vs 67% citywide.
Academic expectations67%city 71%
- The classes at this school prepare me for the next step in my education.85%
- In how many of your classes …are you challenged?.47%
- In how many of your classes …do your teachers have high expectations for you?.79%
- In how many of your classes …are you encouraged to work in small groups?.46%
- In how many of your classes …do your teachers want you to become better thinkers, not just memorize things?.77%
- In how many of your classes …do you get so focused on learning during class activities that you lose track of time?.55%
- In this school, the staff believes that all students can learn, including English language learners (ELLs), Emergent Multilingual Learners (EMLLs), and students with disabilities.76%
- How many students in your classes…have to work hard to do well?.74%
Each question’s favorable response rate; the topic score (67%) is their average, vs 71% citywide.
Clear instruction70%city 73%
- In how many of your classes, this school year, do YOU feel the following statement is true? My teachers make learning expectations clear.76%
- In how many of your classes, this school year, do YOU feel the following statement is true? Class assignments are purposeful in learning the course content.68%
- In how many of your classes, this school year, do YOU feel the following statement is true? The work I do in class is good preparation for class assignments, projects, and assessments.75%
- In how many of your classes, this school year, do YOU feel the following statement is true? I learn a lot from feedback on my work.59%
Each question’s favorable response rate; the topic score (70%) is their average, vs 73% citywide.
College & career guidance81%city 85%
- This school provides me with guidance on the high school application process.74%
- This school provides my family with guidance on the high school application process.67%
- It’s a priority at this school that adults…provide students with guidance on the high school application process.91%
- It’s a priority at this school that adults…provide families with guidance on the high school application process.91%
Each question’s favorable response rate; the topic score (81%) is their average, vs 85% citywide.
Family outreach90%city 94%
- At this school…teachers understand families' challenges and concerns.85%
- At this school…teachers work closely with families to meet students' needs.85%
- At this school…staff regularly communicate with families about how they can help students learn.85%
- At this school…school staff value families' race, ethnicity, culture, family structure, and background.95%
- School staff regularly communicate with me about how I can help my child learn.92%
- Teachers work closely with me to meet my child's needs.87%
- My child's school communicates with me in a language that I can understand.96%
- I am greeted warmly when I contact or visit the school.97%
- My child's school will make me aware if there are any concerns about my child’s social or emotional well-being.91%
Each question’s favorable response rate; the topic score (90%) is their average, vs 94% citywide.
Student–teacher trust70%city 82%
- There is at least one adult at my school that I can confide in.75%
- My teachers are open to students' ideas, suggestions, and comments.71%
- My teachers always do what they say they will do.56%
- My teachers treat me with respect.77%
Each question’s favorable response rate; the topic score (70%) is their average, vs 82% citywide.
Parent–teacher trust97%city 95%
- I feel respected by my child's teachers.95%
- Staff at this school work hard to build trusting relationships with parents/guardians like me.96%
- My child's teachers treat me as a partner in educating my child.99%
Each question’s favorable response rate; the topic score (97%) is their average, vs 95% citywide.
Show all survey topicsShow fewer
Rigorous Instruction
Strong Core Instruction85%city 92%
- In planning my last instructional unit, I had the resources and tools I needed to include multiple opportunities for…reading and writing experiences grounded in evidence from text, both literary and informational. [ELA].89%
- In planning my last instructional unit, I had the resources and tools I needed to include multiple opportunities for…students to interact with complex grade-level text and tasks. [ELA].89%
- In planning my last instructional unit, I had the resources and tools I needed to include multiple opportunities for…students to engage with texts and tasks reflective of their diverse racial, cultural, and linguistic perspective. [ELA].78%
- In planning my last instructional unit, I had the resources and tools I needed to include multiple opportunities for…students to engage in meaningful discussion that critically examines topics that connect to the daily lives of students. [ELA].78%
- In planning my last instructional unit, I had the resources and tools I needed to include multiple opportunities for…focusing deeply on the concepts emphasized in the standards to help students build strong foundations for learning. [ELA].89%
- In planning my last instructional unit, I had the resources and tools I needed to include multiple opportunities for…students to interact with complex grade-level text and tasks. [Math].92%
- In planning my last instructional unit, I had the resources and tools I needed to include multiple opportunities for…students to engage with texts and tasks reflective of their diverse racial, cultural, and linguistic perspective. [Math].77%
- In planning my last instructional unit, I had the resources and tools I needed to include multiple opportunities for…students to engage in meaningful discussion that critically examines topics that connect to the daily lives of students. [Math].85%
- In planning my last instructional unit, I had the resources and tools I needed to include multiple opportunities for…focusing deeply on the concepts emphasized in the standards to help students build strong foundations for learning. [Math].85%
Each question’s favorable response rate; the topic score (85%) is their average, vs 92% citywide.
Quality of Student Discussion57%city 67%
- How many students in your classes…build on each other’s ideas during class discussions?.63%
- How many students in your classes…use data or text references to support their ideas?.58%
- How many students in your classes…show that they respect each other’s ideas?.53%
- How many students in your classes…provide constructive feedback to their peers/teachers?.47%
- How many students in your classes…participate in class discussions at some point?.63%
Each question’s favorable response rate; the topic score (57%) is their average, vs 67% citywide.
Collaborative Teachers
Cultural Awareness and Inclusive Classroom Instruction73%city 89%
- My teachers use examples of students’ different races and cultures in their lessons to make learning more meaningful for me.78%
- My teachers use examples of students’ different backgrounds and families in their lessons to make learning more meaningful for me.60%
- I see a variety of races, ethnicities, cultures, and backgrounds positively represented in the curriculum.78%
- I see a variety of genders, gender identities and expressions and sexual orientations positively represented in the curriculum.51%
- At this school, we have productive conversations about race and racism where I feel my voice is heard.59%
- My teachers treat students of different races, cultures, or backgrounds equally.78%
- My teachers treat students of different genders, gender identities and expressions and sexual orientations equally.78%
- I feel that my teachers respect my culture, background, and identity.90%
- I am able to...receive support around how to incorporate students' cultural and linguistic backgrounds in my practice.65%
- I am able to...modify instructional activities and materials to meet the developmental needs and learning interests of all my students.82%
- I am able to...ensure instruction represents multiple perspectives, cultures, and backgrounds.70%
- I am able to…ensure instruction represents multiple genders, gender identities and expressions and sexual orientations.63%
- I am able to…ensure instruction represents multiple races and ethnicities.90%
- I am able to...design appropriate instruction that is matched to students' need (e.g. English language learners (ELLs) or Emergent Multilingual Learners (EMLLs) proficiency and students with disabilities).62%
- I am able to...apply my knowledge of parents' various cultural backgrounds when collaborating with them regarding their child's educational progress.73%
- I am able to...develop appropriate Individualized Education Programs for my students with disabilities.85%
- I am able to...monitor progress on Individualized Education Program goals for my students with disabilities.81%
- I am able to...distinguish linguistic/cultural differences from learning difficulties.78%
- I have conversations about race and racism at my school that help me examine my own beliefs around identity.62%
Each question’s favorable response rate; the topic score (73%) is their average, vs 89% citywide.
Quality of Professional Development71%city 82%
- Overall, my professional development experiences this year have...included enough time to think carefully about, try, and evaluate new ideas.70%
- Overall, my professional development experiences this year have...Included opportunities to engage in inquiry-based, professional collaboration with peers and/or mentors from other schools.60%
- Overall, my professional development experiences this year have...directly related to my students’ needs.84%
Each question’s favorable response rate; the topic score (71%) is their average, vs 82% citywide.
Peer Collaboration66%city 87%
- At this school…the principal/school leader, teachers, and staff collaborate to make this school run effectively.70%
- At this school…teachers design instructional programs (e.g. lessons, units) together.75%
- At this school…teachers make a conscious effort to coordinate their teaching with instruction at other grade levels.53%
Each question’s favorable response rate; the topic score (66%) is their average, vs 87% citywide.
School Commitment65%city 83%
- I usually look forward to each working day at this school.71%
- I would recommend this school to parents/guardians seeking a place for their child.67%
- I would recommend this school to other teachers as a place to work.57%
Each question’s favorable response rate; the topic score (65%) is their average, vs 83% citywide.
Innovation and Collective Responsibility49%city 79%
- How many teachers at this school…help build a welcoming school environment in the entire school, not just their classroom?.45%
- How many teachers at this school…are actively trying to improve their teaching?.55%
- How many teachers at this school…take responsibility for improving the school?.41%
- How many teachers at this school…are eager to try new ideas?.41%
- How many teachers at this school…feel responsible that all students learn?.64%
Each question’s favorable response rate; the topic score (49%) is their average, vs 79% citywide.
Supportive Environment
Conflict Resolution74%city 79%
- When a conflict arises, school staff use questions to encourage reflection and resolve it.74%
Each question’s favorable response rate; the topic score (74%) is their average, vs 79% citywide.
Classroom Behavior63%city 66%
- How many students in your classes…listen carefully when the teacher gives directions?.60%
- How many students in your classes…follow the rules in class?.70%
- How many students in your classes…respond to challenging questions in class?.55%
- How many students in your classes…do their work when they are supposed to?.68%
Each question’s favorable response rate; the topic score (63%) is their average, vs 66% citywide.
Effective School Leadership
Inclusive Leadership93%city 93%
- The principal/school leader at this school…puts decisions made with families into action.97%
- The principal/school leader at this school…works to create a sense of community in the school.99%
- The principal/school leader at this school…ensures families are comfortable communicating with the school.99%
- I have the opportunity to work with adults at this school to make decisions in important areas that impact my life (e.g. instruction, safety, conflict resolution, etc.).78%
Each question’s favorable response rate; the topic score (93%) is their average, vs 93% citywide.
Instructional Leadership79%city 86%
- The principal/school leader at this school...makes clear to the staff their expectations for meeting instructional goals.75%
- The principal/school leader at this school...understands how children learn.80%
- The principal/school leader at this school...sets high standards for student learning.80%
- The principal/school leader at this school...participates in instructional planning with teams of teachers.79%
- The principal/assistant principal(s) at this school…supports teachers in implementing what they have learned in professional development.79%
- The principal/assistant principal(s) at this school…carefully tracks student academic progress.95%
- The principal/assistant principal(s) at this school…knows what’s going on in my classes.74%
- The principal/assistant principal(s) at this school…provides teachers with formative feedback to improve practice.79%
- How many adults at this school…have access to school-based supports to assist in behavioral/emotional escalations?.72%
Each question’s favorable response rate; the topic score (79%) is their average, vs 86% citywide.
Program Coherence61%city 83%
- At this school…once we start a new program, we follow up to make sure that it’s working.55%
- At this school…it is clear how all of the programs offered are connected to our school’s instructional vision.65%
- At this school…curriculum, instruction, and learning materials are well coordinated across the different grade levels at this school.63%
Each question’s favorable response rate; the topic score (61%) is their average, vs 83% citywide.
Teacher Influence39%city 66%
- At this school…the principal/school leader encourages feedback through regular meetings with families and teacher leaders.85%
- How much influence do teachers have over school policy in...hiring new professional personnel?.16%
- How much influence do teachers have over school policy in...planning how discretionary school funds should be used?.16%
- How much influence do teachers have over school policy in...selecting instructional materials and/or curriculum used in classrooms?.21%
- How much influence do teachers have over school policy in...setting standards for student behavior?.58%
Each question’s favorable response rate; the topic score (39%) is their average, vs 66% citywide.
Strong Family-Community Ties
Strong Relationships94%city 90%
- At this school, my child receives what they need to achieve their Individualized Education Plan (IEP) goal(s). [Families of students with IEPs].94%
Each question’s favorable response rate; the topic score (94%) is their average, vs 90% citywide.
Building Families' Capacity as their Child's Primary Teacher89%city 96%
- My child’s teachers give me helpful ideas about how I can support my child’s learning and development. [Birth-5].86%
- My child’s teachers let me know that I can make a difference in my child’s learning. [Birth-5].92%
Each question’s favorable response rate; the topic score (89%) is their average, vs 96% citywide.
Parent Involvement in School74%city 71%
- Since the beginning of the school year, how often have you…communicated with your child's teachers about your child's performance?.88%
- Since the beginning of the school year, how often have you…seen your child’s projects, artwork, homework, tests, or quizzes?.95%
- My child’s teachers let me know that I can make a difference in my child’s learning. [Birth-5].92%
- I know how to contact the Parent Coordinator at my child’s school.19%
Each question’s favorable response rate; the topic score (74%) is their average, vs 71% citywide.
Trust
Parent-Principal Trust96%city 94%
- I feel respected by my child's principal/school leader.97%
- I trust the principal/school leader at their word (to do what they say that they will do).95%
- The principal/school leader is an effective manager who makes the school run smoothly.96%
Each question’s favorable response rate; the topic score (96%) is their average, vs 94% citywide.
Teacher-Principal Trust84%city 84%
- I feel respected by the principal/school leader at this school.95%
- The principal/school leader at this school is an effective manager who makes the school run smoothly.85%
- The principal/school leader has confidence in the expertise of the teachers at this school.86%
- I trust the principal/school leader at their word (to do what they say that they will do).76%
- The principal/school leader looks out for the personal welfare of the staff members.81%
- The principal/school leader places the needs of children ahead of personal interests.90%
- The principal and assistant principals function as a cohesive unit.74%
Each question’s favorable response rate; the topic score (84%) is their average, vs 84% citywide.
Teacher-Teacher Trust75%city 86%
- Teachers in this school trust each other.62%
- It's OK in this school to discuss feelings, worries, and frustrations with other teachers.67%
- I feel respected by other teachers at this school.95%
Each question’s favorable response rate; the topic score (75%) is their average, vs 86% citywide.
Student-Student Trust49%city 70%
- Most students at this school treat each other with respect.35%
- Most students treat students from different cultures or backgrounds equally.62%
Each question’s favorable response rate; the topic score (49%) is their average, vs 70% citywide.
Overall positive % is averaged across every Pos/Neg survey question per respondent group (school year 2023-2024). Survey topics are the DOE’s framework measures (each the average favorable response across its questions; expand a topic to see them and the citywide average); the dimension scores themselves are no longer in the public data file.[3]
Operational health
Attendance
—
Chronic absenteeism
—
Suspension rate
0%
Teachers[7]
Teachers with 4+ years' experience
59%
Students per teacher
12:1
Teaching out of certification
83%
Teacher experience and certification from the NYSED School Report Card (2024–25); students per teacher = enrollment ÷ reported teachers. Fewer than 4 years counts as inexperienced.
Student body
Race / ethnicity[4]
- Asian 2%
- Black 46%
- Hispanic 49%
- White 1%
- Multiracial 1%
School-level totals; may not sum to 100% due to rounding and small subgroup suppression.
Gender[4]
- Female 3%
- Male 97%
Female / male shares as published by the DOE; other gender identities aren’t reported in the source data.
Enrollment
477
Economic Need Index
92%
Free / reduced lunch
90%
English learners
8%
Students with IEPs
30%
Location & commute
Where the school is and how to get there.