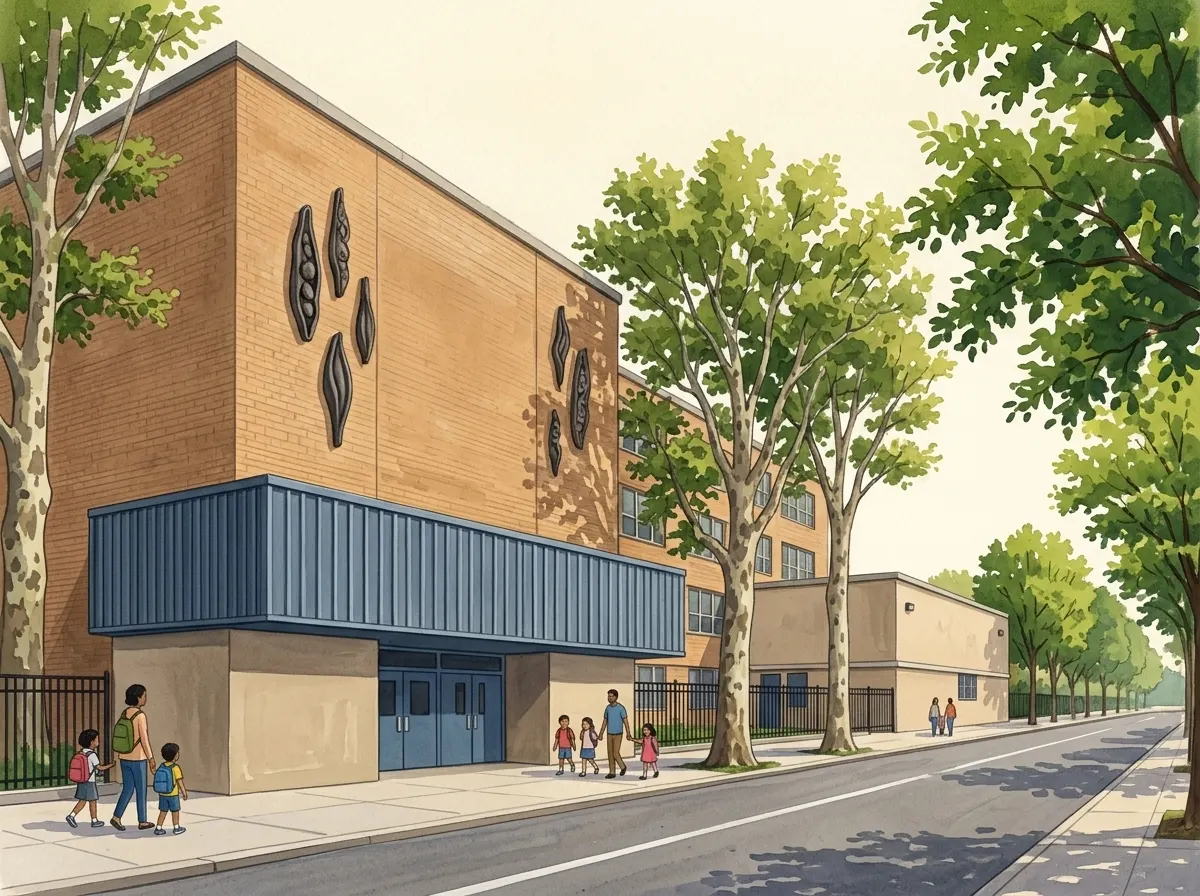
Achievement First Apollo Charter School
Image © Google

Achievement First Apollo Charter School

Viewing

Grades K-8 · 350 LINWOOD STREET · Brooklyn

Jabari Sims, Principal · 718-235-2647

84K774Charter

About

Achievement First Apollo Charter School is a K-8 charter school in Brooklyn, committed to preparing students for college and career by fostering academic and character skills to address educational inequities. The school demonstrates strong academic performance, with math proficiency rates well above the citywide median, and ELA proficiency at the median. Its approach emphasizes a rigorous, college-preparatory curriculum, an extended school day, and a longer school year designed to accelerate student learning. Parents responding to the school's survey express overwhelmingly positive sentiment regarding their experience. External reviews, however, present a more nuanced picture; while some families commend the dedicated teachers and significant academic growth, particularly in reading, others have raised concerns about a rigid disciplinary system, perceived overemphasis on minor issues, and the handling of bullying. The school aims to cultivate a disciplined yet joyful learning environment, prioritizing student engagement and a love for learning, though some reviews suggest a limited range of extracurricular activities.

Sources (25)

Academics

State test proficiency rates and acceleration.

ELA proficiency

55%

Math proficiency

64%

Proficiency rates are from the Grade 3–8 NYS state test (school-level).

Attendance rate

95%

Avg class size (general ed)

Avg class size (ICT)

Community & climate

Demographics, attendance, school survey results, and DOE quality ratings.

Quality signals

FacultyExcellentAI-estimated

Parent survey · overall positive

93%19% response rate

Student survey · overall positive

84%2% response rate

Survey topics

Safety83%city 75%
  • Conflicts are resolved fairly in this school.100%
  • I feel safe…outside around this school.83%
  • I feel safe…traveling between home and this school.83%
  • I feel safe…in the hallways, bathrooms, locker rooms, and cafeteria of this school.100%
  • I feel safe…in my classes at this school.100%
  • School Safety Agents promote a safe and respectful environment.100%
  • At this school students drink alcohol, use illegal drugs, or abuse prescription drugs.67%
  • At this school students get into physical fights.50%
  • At this school there is gang activity.67%

Each question’s favorable response rate; the topic score (83%) is their average, vs 75% citywide.

Bullying prevention57%city 59%
  • At this school students harass, bully, or intimidate other students.50%
  • At this school students harass, bully, or intimidate each other because of their race, religion, ethnicity, national origin, language/accent, or citizenship/immigration status.67%
  • At this school students harass, bully, or intimidate each other because of their gender, gender identity, gender expression, or sexual orientation.67%
  • At this school students harass, bully, or intimidate each other because of other differences, like different body type or disability.50%
  • At this school students harass, bully, or intimidate each other online (through mobile phones, social media, email, or other forms of electronic communication).50%

Each question’s favorable response rate; the topic score (57%) is their average, vs 59% citywide.

Emotional support75%city 61%
  • I know where to go at my school if I need additional support with my mental-health.100%
  • During this school year, most days I have felt happy when at school.83%
  • During this school year, most days I have felt safe when at school.100%
  • During this school year, most days I have felt optimistic when at school.83%
  • During this school year, most days I have felt bored when at school.50%
  • During this school year, most days I have felt stressed when at school.50%
  • During this school year, most days I have felt worried when at school.67%
  • There is time at school to talk about feelings and emotions.67%

Each question’s favorable response rate; the topic score (75%) is their average, vs 61% citywide.

Personal attention83%city 67%
  • In how many of your classes, this school year, do YOU feel the following statement is true? My teachers…ask if I have everything that I need to succeed in their class.67%
  • In how many of your classes, this school year, do YOU feel the following statement is true? My teachers…give me specific suggestions about how I can improve my work in class.83%
  • In how many of your classes, this school year, do YOU feel the following statement is true? My teachers…explain things a different way if I don't understand something in class.80%
  • In how many of your classes, this school year, do YOU feel the following statement is true? My teachers…support me when I am upset.83%
  • Adults at this school check in with me frequently about how I’m doing personally.67%
  • Adults at this school check in with me frequently about how I’m doing academically.100%
  • I feel like I belong at this school.100%

Each question’s favorable response rate; the topic score (83%) is their average, vs 67% citywide.

Academic expectations89%city 66%
  • The classes at this school prepare me for the next step in my education.83%
  • In how many of your classes …are you challenged?.83%
  • In how many of your classes …do your teachers have high expectations for you?.100%
  • In how many of your classes …are you encouraged to work in small groups?.83%
  • In how many of your classes …do your teachers want you to become better thinkers, not just memorize things?.83%
  • In how many of your classes …do you get so focused on learning during class activities that you lose track of time?.100%

Each question’s favorable response rate; the topic score (89%) is their average, vs 66% citywide.

Clear instruction96%city 73%
  • In how many of your classes, this school year, do YOU feel the following statement is true? My teachers make learning expectations clear.100%
  • In how many of your classes, this school year, do YOU feel the following statement is true? Class assignments are purposeful in learning the course content.100%
  • In how many of your classes, this school year, do YOU feel the following statement is true? The work I do in class is good preparation for class assignments, projects, and assessments.100%
  • In how many of your classes, this school year, do YOU feel the following statement is true? I learn a lot from feedback on my work.83%

Each question’s favorable response rate; the topic score (96%) is their average, vs 73% citywide.

College & career guidance83%city 80%
  • This school provides me with guidance on the high school application process.83%
  • This school provides my family with guidance on the high school application process.83%

Each question’s favorable response rate; the topic score (83%) is their average, vs 80% citywide.

Family outreach99%city 94%
  • School staff regularly communicate with me about how I can help my child learn.94%
  • Teachers work closely with me to meet my child's needs.100%
  • My child's school communicates with me in a language that I can understand.100%
  • I am greeted warmly when I contact or visit the school.100%
  • My child's school will make me aware if there are any concerns about my child’s social or emotional well-being.100%

Each question’s favorable response rate; the topic score (99%) is their average, vs 94% citywide.

Student–teacher trust92%city 82%
  • There is at least one adult at my school that I can confide in.100%
  • My teachers are open to students' ideas, suggestions, and comments.83%
  • My teachers always do what they say they will do.83%
  • My teachers treat me with respect.100%

Each question’s favorable response rate; the topic score (92%) is their average, vs 82% citywide.

Parent–teacher trust100%city 95%
  • I feel respected by my child's teachers.100%
  • Staff at this school work hard to build trusting relationships with parents/guardians like me.100%
  • My child's teachers treat me as a partner in educating my child.100%

Each question’s favorable response rate; the topic score (100%) is their average, vs 95% citywide.

Show all survey topics

Collaborative Teachers

Cultural Awareness and Inclusive Classroom Instruction93%city 85%
  • My teachers use examples of students’ different races and cultures in their lessons to make learning more meaningful for me.100%
  • My teachers use examples of students’ different backgrounds and families in their lessons to make learning more meaningful for me.83%
  • I see a variety of races, ethnicities, cultures, and backgrounds positively represented in the curriculum.100%
  • I see a variety of genders, gender identities and expressions and sexual orientations positively represented in the curriculum.80%
  • At this school, we have productive conversations about race and racism where I feel my voice is heard.100%
  • My teachers treat students of different races, cultures, or backgrounds equally.100%
  • My teachers treat students of different genders, gender identities and expressions and sexual orientations equally.83%
  • I feel that my teachers respect my culture, background, and identity.100%

Each question’s favorable response rate; the topic score (93%) is their average, vs 85% citywide.

Supportive Environment

Conflict Resolution100%city 79%
  • When a conflict arises, school staff use questions to encourage reflection and resolve it.100%

Each question’s favorable response rate; the topic score (100%) is their average, vs 79% citywide.

Effective School Leadership

Inclusive Leadership96%city 93%
  • The principal/school leader at this school…puts decisions made with families into action.100%
  • The principal/school leader at this school…works to create a sense of community in the school.100%
  • The principal/school leader at this school…ensures families are comfortable communicating with the school.100%
  • I have the opportunity to work with adults at this school to make decisions in important areas that impact my life (e.g. instruction, safety, conflict resolution, etc.).83%

Each question’s favorable response rate; the topic score (96%) is their average, vs 93% citywide.

Strong Family-Community Ties

Parent Involvement in School76%city 63%
  • Since the beginning of the school year, how often have you…communicated with your child's teachers about your child's performance?.94%
  • Since the beginning of the school year, how often have you…seen your child’s projects, artwork, homework, tests, or quizzes?.100%
  • I know how to contact the Parent Coordinator at my child’s school.33%

Each question’s favorable response rate; the topic score (76%) is their average, vs 63% citywide.

Trust

Parent-Principal Trust100%city 94%
  • I feel respected by my child's principal/school leader.100%
  • I trust the principal/school leader at their word (to do what they say that they will do).100%
  • The principal/school leader is an effective manager who makes the school run smoothly.100%

Each question’s favorable response rate; the topic score (100%) is their average, vs 94% citywide.

Student-Student Trust90%city 70%
  • Most students at this school treat each other with respect.80%
  • Most students treat students from different cultures or backgrounds equally.100%

Each question’s favorable response rate; the topic score (90%) is their average, vs 70% citywide.

Overall positive % is averaged across every Pos/Neg survey question per respondent group (school year 2023-2024). Survey topics are the DOE’s framework measures (each the average favorable response across its questions; expand a topic to see them and the citywide average); the dimension scores themselves are no longer in the public data file.[3]

Operational health

Attendance

95%

Chronic absenteeism

29%

Suspension rate

4%

Teachers[7]

Teachers with 4+ years' experience

64%

Students per teacher

17:1

Teaching out of certification

89%

Teacher experience and certification from the NYSED School Report Card (2024–25); students per teacher = enrollment ÷ reported teachers. Fewer than 4 years counts as inexperienced.

Student body

Race / ethnicity[4]

  • Asian 8%
  • Black 48%
  • Hispanic 40%
  • Multiracial 1%

School-level totals; may not sum to 100% due to rounding and small subgroup suppression.

Gender[4]

  • Female 48%
  • Male 52%

Female / male shares as published by the DOE; other gender identities aren’t reported in the source data.

Enrollment

763

Economic Need Index

84%

Free / reduced lunch

88%

English learners

11%

Students with IEPs

14%

Location & commute

Where the school is and how to get there.

Loading map…

Data sources

  1. 1.MySchools / NYC DOE: Program descriptions, course, club, and arts offerings.
  2. 3.NYC DOE School Survey: Parent, teacher, and student survey results.
  3. 4.NYC DOE Demographic Snapshot: Enrollment and demographic breakdowns.
  4. 7.NYSED School Report Card: Teacher experience, certification, and pupil-teacher ratio.