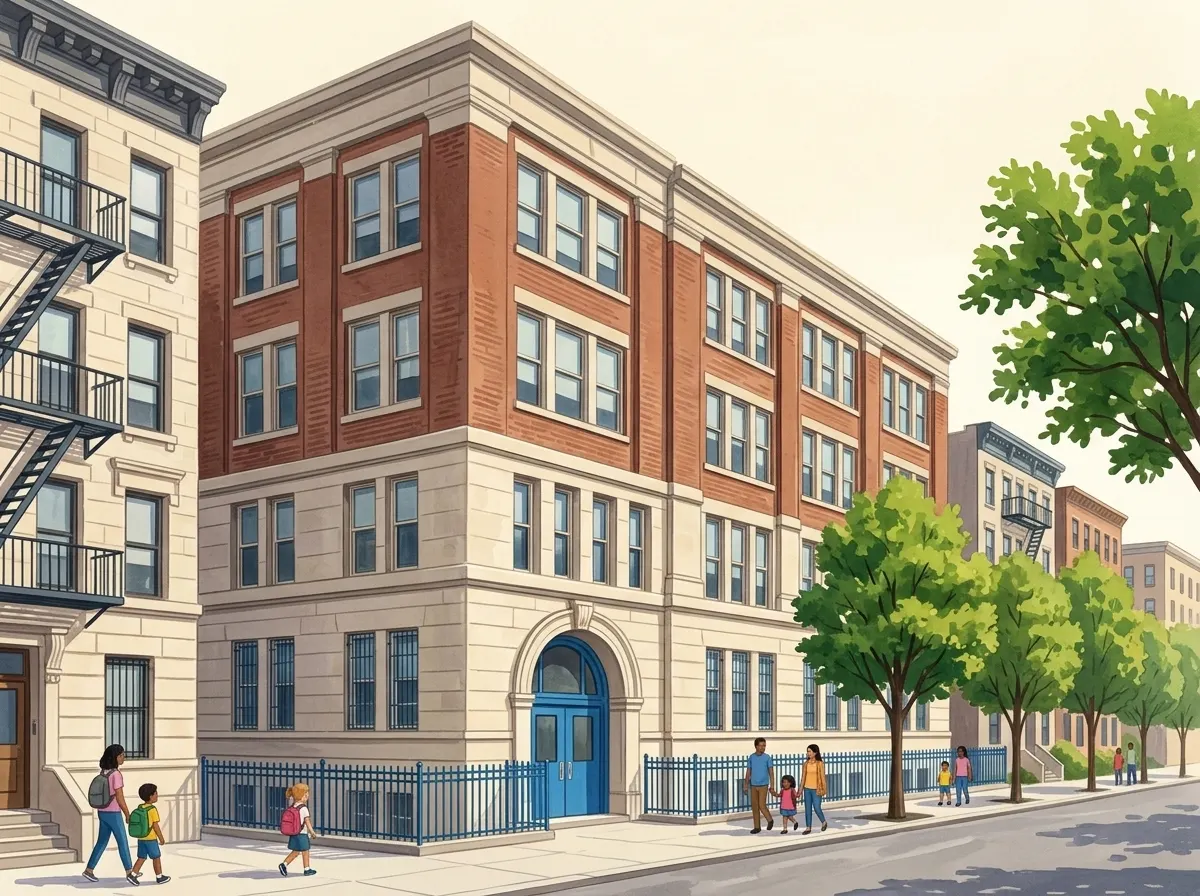
Opportunity Charter School
- 240 WEST 113 STREET, Manhattan
- Grades 6-12
- Jessica Marcu/Kaitlin Francis, Principal
- 212-866-6137
About
Opportunity Charter School serves 385 students in grades 6-12 in Manhattan. The school describes its mission as providing intensive intervention for students at high risk of academic failure, many with complex learning disabilities, to foster academic excellence and prepare them for college or careers. The school has a very high Economic Need Index of 95 percent, at the citywide maximum, and a significantly higher percentage of students with Individualized Education Programs at 46 percent, well above the citywide 75th percentile. The percentage of English Language Learners, at 15 percent, is near the citywide median. For middle school grades, state test proficiency rates are a concern, with 23 percent in ELA and 14 percent in Math, both well below the citywide 25th percentile. The percentage of students taking accelerated coursework, at 6 percent, is near the citywide 25th percentile. High school outcomes include a 4-year graduation rate of 91 percent, which is near the citywide median. However, the college enrollment rate of 45.5 percent is below the citywide 25th percentile. Regents pass rates show 58.1 percent in English, but lower rates in other subjects, such as 16.7 percent in Algebra I and 8.9 percent in Living Environment. Parent and student survey results are not available for this school.
Sources (3)
- NYC DOE Location Code Generating and Management System (LCGMS) · 2026-27 (export of 2026-08-22)
- NYC DOE School Quality Reports and Snapshot, 2024-25 · 2024-25
- NYC School Survey (parent and student responses)
Academics
State test proficiency rates and acceleration.
ELA proficiency
23%
Math proficiency
14%
Proficiency rates are from the Grade 3–8 NYS state test (school-level).
Attendance rate
93%
Avg class size (general ed)
—
Avg class size (ICT)
—
Community & climate
Demographics, attendance, school survey results, and DOE quality ratings.
Quality signals
NYC School Survey, 2025-26
Overall positive % is averaged across every Pos/Neg survey question per respondent group (school year 2025-2026). Survey topics are the DOE’s framework measures (each the average favorable response across its questions; expand a topic to see them and the citywide average); the dimension scores themselves are no longer in the public data file.[3]
Operational health
Attendance
93%
Chronic absenteeism
1%
Suspension rate
12%
Teachers[7]
Teachers with 4+ years' experience
85%
Students per teacher
11:1
Teaching out of certification
75%
Teacher experience and certification from the NYSED School Report Card (2024–25); students per teacher = enrollment ÷ reported teachers. Fewer than 4 years counts as inexperienced.
Student body
Race / ethnicity[4]
- Black 46%
- Hispanic 49%
- Multiracial 1%
School-level totals; may not sum to 100% due to rounding and small subgroup suppression.
Gender[4]
- Female 46%
- Male 54%
Female / male shares as published by the DOE; other gender identities aren’t reported in the source data.
Enrollment
385
Economic Need Index
95%
Free / reduced lunch
95%
English learners
15%
Students with IEPs
46%
Admissions
No program-level admissions data is available for this school yet.
Financials
[8]What this school has to spend, and what it spends it on. Spending is not a measure of quality. Schools serving more students with higher needs receive more money.
Charter schools manage their own budgets rather than receiving a school allocation from the DOE, so the staffing and supplies breakdown the DOE publishes for district schools is not published for this school.
Spending
Total spend
$11.9MStudents: 383
38th percentile citywide
Total spend per student
$31,068
36th percentile citywide · city median $33,357
Location & commute
Where the school is and how to get there.