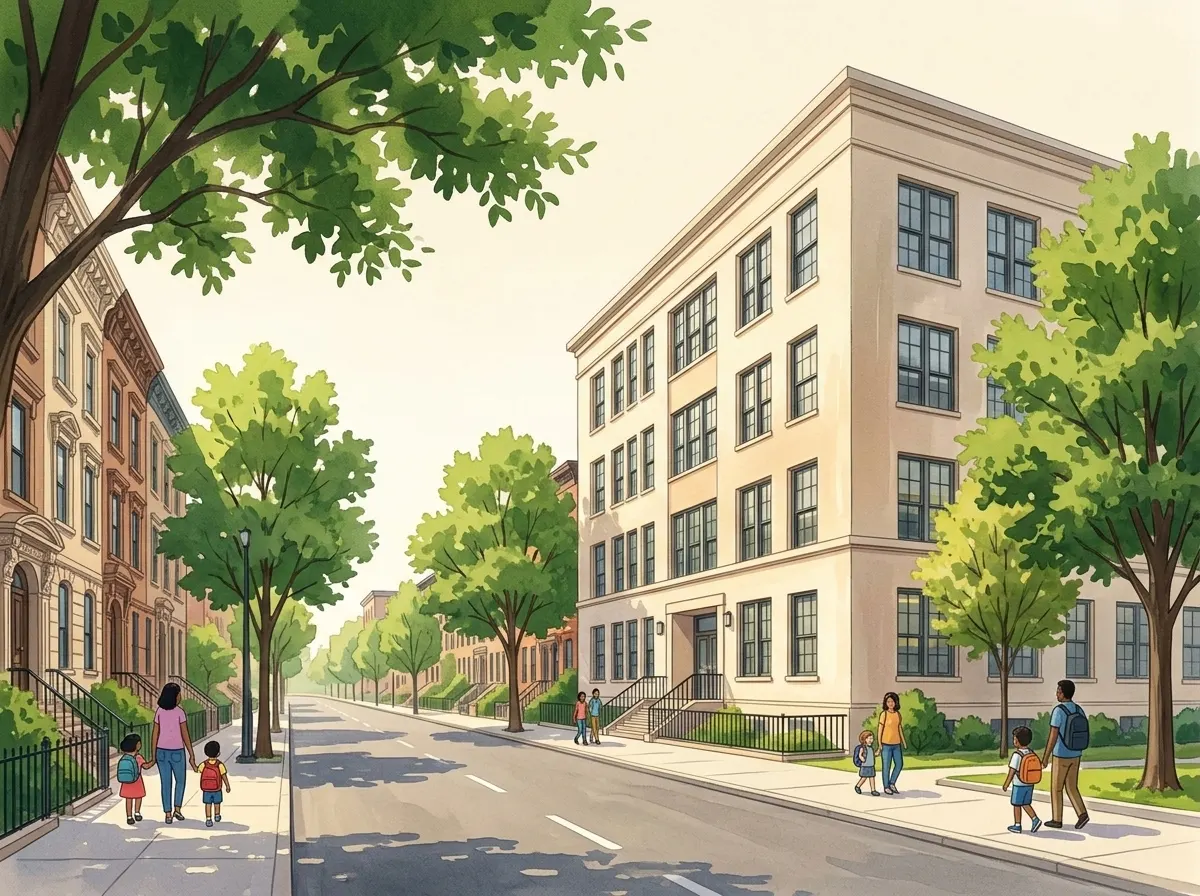
P.S. 137 Rachel Jean Mitchell
- 121 SARATOGA AVENUE, Brooklyn
- Grades PK-5
- Suzette Rose, Principal
- 718-453-2926
About
P.S. 137 Rachel Jean Mitchell serves students in grades PK-5 in Brooklyn, with a small enrollment of 120 students, which is below the citywide 25th percentile. The school has a high Economic Need Index of 91.0 percent, placing it above the citywide 75th percentile, and 38.0 percent of students have an Individualized Education Program, also above the citywide 75th percentile. English Language Learners make up 13.0 percent of the student body, near the citywide median. In elementary grades, 41.0 percent of students demonstrated proficiency in ELA, which is near the citywide 25th percentile, while 54.0 percent were proficient in Math, near the citywide median. The school reports a 0.0 percent suspension rate. In the 2025-26 DOE School Survey, 100 percent of parents surveyed felt their child is safe at school and that the school is kept clean. Parents also reported high satisfaction with communication and trust in leadership, with 93 percent trusting the principal and 95 percent reporting staff work hard to build trusting relationships.
Sources (5)
- NYC DOE Location Code Generating and Management System (LCGMS) · 2026-27 (export of 2026-08-22)
- NYC DOE School Quality Reports and Snapshot, 2024-25 · 2024-25
- New York State Education Department School Report Card · 2024-25
- NYC School Survey (parent and student responses) · 2025-26
- MySchools admissions directory, 2025-26 cycle · 2025-26 admissions cycle
Academics
Coursework, class size, and academic context.
Attendance rate
96%
Avg class size (general ed)
17.5
Avg class size (ICT)
20.5
Average class size by classroom setting: general education vs. ICT (Integrated Co-Teaching, where general- and special-education students learn together with two teachers). NYC DOE Class Size Report, 2021–22.
Community & climate
Demographics, attendance, school survey results, and DOE quality ratings.
Quality signals
DOE quality-rating labels are skewed across the system; read them relative to the citywide distribution in our methodology.
NYC School Survey, 2025-26
Parent survey · overall positive
88%31% response rate
Survey topics, 2025-26
Family outreach93%city 94%
- Parents · School staff regularly communicate with me about how I can help my child learn.93%
- Parents · Teachers work closely with me to meet my child's needs.88%
- Parents · My child's school communicates with me in a language that I can understand.98%
- Parents · I am greeted warmly when I contact or visit the school.98%
- Parents · My child's school will make me aware if there are any concerns about my child’s social or emotional well-being.98%
- Parents · If I suspect my child needs additional learning supports and services, I know the next steps to get support at my school.85%
Each question’s favorable response rate; the topic score (93%) is their average, vs 94% citywide.
Parent–teacher trust89%city 96%
- Parents · I feel respected by my child's teachers.88%
- Parents · Staff at this school work hard to build trusting relationships with parents/guardians like me.95%
- Parents · My child's teachers treat me as a partner in educating my child.85%
Each question’s favorable response rate; the topic score (89%) is their average, vs 96% citywide.
Show all survey topicsShow fewer
Instruction and Performance
IEP Service Satisfaction84%city 91%
- Parents · I am satisfied with the educational planning and Individualized Education Program (IEP) development process at this school. [Families of students with IEPs].88%
- Parents · At this school, my child receives what they need to achieve their Individualized Education Program (IEP) goal(s). [Families of students with IEPs].89%
- Parents · This school offers a wide enough variety of activities and services (including specialized programs, related services and assistive and adaptive technologies where appropriate) to help improve outcomes for my child. [Families of students with IEPs].75%
Each question’s favorable response rate; the topic score (84%) is their average, vs 91% citywide.
Family Satisfaction with Child's Education83%city 94%
- Parents · My child is progressing in reading the way I would expect.85%
- Parents · My child is progressing in math the way I would expect.75%
- Parents · My child's school helps me understand what grade-level schoolwork looks like.75%
- Parents · How satisfied are you with the following? The education my child has received this year.90%
- Parents · How satisfied are you with the following? The overall quality of my child's teachers this year.88%
Each question’s favorable response rate; the topic score (83%) is their average, vs 94% citywide.
Safety and School Climate
Inclusive Leadership93%city 96%
- Parents · The principal/school leader at this school…puts decisions made with families into action.90%
- Parents · The principal/school leader at this school…works to create a sense of community in the school.95%
- Parents · The principal/school leader at this school…ensures families are comfortable communicating with the school.95%
- Parents · Language translation and interpretation are readily available to me at all family events at my child’s school.93%
Each question’s favorable response rate; the topic score (93%) is their average, vs 96% citywide.
Conflict Resolution87%city 93%
- Parents · Conflicts are resolved fairly at my child’s school. [Grades K-5].87%
Each question’s favorable response rate; the topic score (87%) is their average, vs 93% citywide.
Relationships with Families
Parent-Principal Trust95%city 96%
- Parents · I feel respected by my child's principal/school leader.98%
- Parents · I trust the principal/school leader at their word (to do what they say that they will do).95%
- Parents · The principal/school leader is an effective manager who makes the school run smoothly.93%
Each question’s favorable response rate; the topic score (95%) is their average, vs 96% citywide.
Parent Involvement in School88%city 92%
- Parents · Since the beginning of the school year, how often have you…communicated with your child's teachers about your child's performance?91%
- Parents · Since the beginning of the school year, how often have you…seen your child’s projects, artwork, homework, tests, or quizzes?83%
- Parents · I know how to contact the Parent Coordinator at my child’s school.95%
- Parents · During the school year, have you...attended a school meeting, school event, or parent-teacher conference (virtually or in-person)?98%
- Parents · My child’s teachers incorporate my feedback into how they support my child. [Birth-5].75%
Each question’s favorable response rate; the topic score (88%) is their average, vs 92% citywide.
Building Families' Capacity as their Child's Primary Teacher78%city 96%
- Parents · My child’s teachers give me helpful ideas about how I can support my child’s learning and development. [Birth-5].78%
- Parents · My child’s teachers let me know that I can make a difference in my child’s learning. [Birth-5].78%
Each question’s favorable response rate; the topic score (78%) is their average, vs 96% citywide.
Strong Relationships78%city 97%
- Parents · I feel good about the way that my child’s teachers helped my child adjust to their program. [Birth-5].78%
Each question’s favorable response rate; the topic score (78%) is their average, vs 97% citywide.
School Description
School Facilities and Services84%city 91%
- Parents · This school is kept clean.100%
- Parents · This school is kept in good physical condition.95%
- Parents · My child's school provides me information about transportation options (e.g. Metrocard and busing).71%
- Parents · I am satisfied with my child’s school bus transportation service this year.78%
- Parents · I am satisfied with the meal options provided at my child’s school.76%
Each question’s favorable response rate; the topic score (84%) is their average, vs 91% citywide.
Overall positive % is averaged across every Pos/Neg survey question per respondent group (school year 2025-2026). Survey topics are the DOE’s framework measures (each the average favorable response across its questions; expand a topic to see them and the citywide average); the dimension scores themselves are no longer in the public data file.[3]
Operational health
Attendance
96%
Chronic absenteeism
47%
Suspension rate
0%
Teachers[7]
Teachers with 4+ years' experience
47%
Students per teacher
6:1
Teaching out of certification
11%
Teacher experience and certification from the NYSED School Report Card (2024–25); students per teacher = enrollment ÷ reported teachers. Fewer than 4 years counts as inexperienced.
Student body
Race / ethnicity[4]
- Black 63%
- Hispanic 29%
- White 2%
- Multiracial 4%
School-level totals; may not sum to 100% due to rounding and small subgroup suppression.
Gender[4]
- Female 54%
- Male 46%
Female / male shares as published by the DOE; other gender identities aren’t reported in the source data.
Enrollment
120
Economic Need Index
91%
Free / reduced lunch
88%
English learners
13%
Students with IEPs
38%
Admissions
2 programs. Each has its own admissions method, and each track within a program has its own seats, demand, and priority order.
3-K - School Day
Program code 23K1373K · Cycle 2024-2025
17 applicants · 15 seats last year; every priority group with applicants received offers.
| priority group | Seats | Applicants | Applications / seat |
|---|---|---|---|
| General education | 15 | 17 | — |
↳ Students who live in the district and have a sibling at the school. | — | — | — |
↳ Students who live outside the district and have a sibling at the school. | — | — | — |
↳ Other students who live in the district. | 10 | 10 | 1.00 |
↳ All other applicants. | — | — | — |
Last year’s published figures. Schools make more offers than seats because not everyone enrolls, so offers can exceed seats. Counts under 10 are suppressed (shown as “<10”).
Pre-K - School Day
Program code 23K137PK · Cycle 2024-2025
16 applicants · 18 seats last year; every priority group with applicants received offers.
| priority group | Seats | Applicants | Applications / seat |
|---|---|---|---|
| General education | 18 | 16 | — |
↳ Current students. | 10 | 10 | 1.00 |
↳ Students who live in the district and have a sibling at the school. | — | — | — |
↳ Students who live outside the district and have a sibling at the school. | — | — | — |
↳ Other students who live in the district. | — | — | — |
↳ All other applicants. | — | — | — |
Last year’s published figures. Schools make more offers than seats because not everyone enrolls, so offers can exceed seats. Counts under 10 are suppressed (shown as “<10”).
How to read Applications / seat and where the outlook buckets come from is explained in our methodology.
Spending
Total spend
$6.9MStudents: 147
9th percentile citywide
School-managed budget
$4.0MPositions: 32
8th percentile citywide
Total spend per student
$46,969
89th percentile citywide · city median $33,357
Staffing costs
Principal’s salary
$203K
54th percentile citywide
Principal and assistant principals
$352KPositions: 2
23rd percentile citywide
Teaching staff
$2.3MPositions: 19
14th percentile citywide
Where the school-managed budget goes
These five categories add up to the school-managed budget. They do not include the centrally-paid costs in total spend.
Leadership2$176K$352K
- HEAD OF SCHOOL1$203K$203K
- ASST HEAD OF SCHOOL1$149K$149K
Teachers19$120K$2.3M
- 3-K / WHOLE CLASS1$157K$157K
- Pre K / WHOLE CLASS1$157K$157K
- 2,3 / SELF-CONTAINED SP ED1$154K$154K
- MUSIC / WHOLE CLASS1$154K$154K
- 1 / WHOLE CLASS1$139K$139K
- 5 / ICT - General Ed Teacher1$133K$133K
- K / WHOLE CLASS1$120K$120K
- 5 / ICT - Special Ed Teacher1$120K$120K
- 2 / ICT - Special Ed Teacher1$117K$117K
- 2 / WHOLE CLASS1$115K$115K
- 4 / ICT - Special Ed Teacher1$114K$114K
- K / ICT - Special Ed Teacher1$113K$113K
- 2 / ICT - General Ed Teacher1$112K$112K
- ESL / WHOLE CLASS1$107K$107K
- DANCE ALL OTHER / WHOLE CLASS1$107K$107K
- K / ICT - General Ed Teacher1$107K$107K
- PHYSICAL EDUCATION / WHOLE CLASS1$107K$107K
- LIBRARY / WHOLE CLASS1$98K$98K
- 3 / ICT - Special Ed Teacher1$41K$41K
Support staff10$71K$709K
- IEP-CRISIS MANAGEMENT(CIT)4$51K$203K
- Guidance Counselor1$129K$129K
- SPEECH / PUSH IN/PULL OUT1$117K$117K
- OCCUPATIONAL THERAPY / PUSH IN/PULL OUT1$91K$91K
- School Secretary1$73K$73K
- CLASSROOM - General Ed1$52K$52K
- PARENT COORDINATOR1$44K$44K
Programs and extra time$433K
- Absence Coverage$139K
- SUBJECT SPECIFIC1$86K$86K
- AFTER/BEFORE SCHOOL STUDENT PROGRAMS$81K
- People Working Partial Year$66K
- IEP-CRISIS MANAGEMENT(CIT)$45K
- Not Available$16K
Supplies and services$275K
- Non-Contractual Services$107K
- Educational Consultants$91K
- Supplies - General$43K
- Transportation of Staff - Non-Contract$11K
- Educational Software$9,645
- Curriculum & Staff Development Contracts$5,850
- School Funded Copier$4,644
- Equipment - General$1,822
- Data Processing Repair - Contractual$795
- Library Books$744
- Telephone and Other Communications$224
Location & commute
Where the school is and how to get there.